

Dashcrab

Dashcrab for Creators

Stop counting
views.
Start
understanding
them.

Connect Instagram, TikTok, YouTube, and LinkedIn. See what made people stop, watch, skip and engage… and know what to create next.

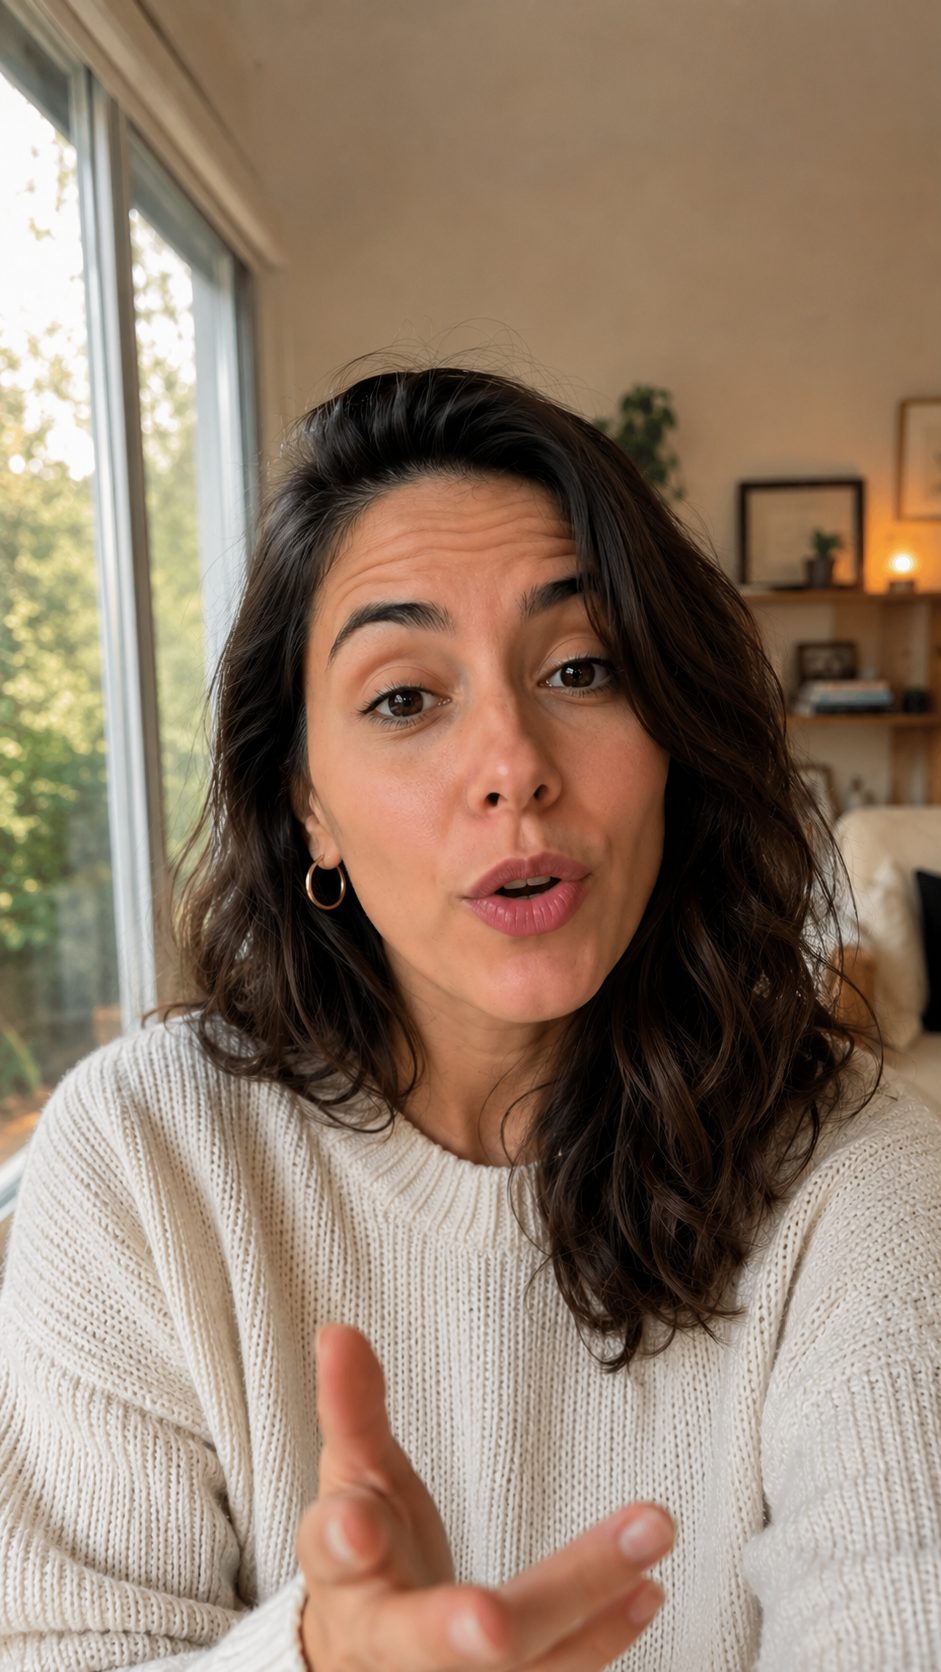
Creator talking to the camera in a vertical reel frame
Virality

41% skip rate · 7.2 s average watch time

Connect Instagram TikTok YouTube LinkedIn Google Analytics · 10 seconds each

01 · The feed

All your pieces,
one single grid.

Instagram, TikTok, YouTube, and LinkedIn in one feed, sortable by views, impressions, likes, or date. Each card carries its main KPI, the metrics that platform actually reports, and a signal band explaining what happened with the piece.

One card, four layers

Layer 1 Identity. Platform, format (Reel, Story, Post, Carousel, Short, Video), and when it was published.
Layer 2 Main KPI. It changes by platform: Instagram shows engagement rate, YouTube retention and CTR, TikTok views, LinkedIn impressions.
Layer 3 Real metrics. Only the ones the platform actually reports. If there is no data, we do not invent an empty cell.
Layer 4 Signal band. Virality, navigation, retention, consumption, or profile, with a small visualization and one sentence in plain language.
Reel cover: the creator holding a mug in her living room
Reel Instagram

My autumn routine, short version

8,4 % Engagement rate
882kViews 614kReach 14.2kSaves 3.1kShares
Virality Peak at 6 h

41 % skip rate and 7.2 s average watch time. Reach hit half in 2 h 40.

02 · Signals

Every platform
lies differently.

A like does not mean the same thing on a Reel as on a Short. That is why each platform brings its own signal, with the metrics only it reports, translated into a sentence you understand without opening anyone's documentation.

Instagram · Reel

Virality

How many people skipped the reel before finishing it and how long they watched. The tracker takes snapshots up to 24 h after publishing, so you see the full reach curve and the exact moment of the peak.

41 %Skip rate 7.2 sAverage watch time 2 h 40At 50 % of reach
Instagram · Story

Navigation

What people do when they reach this story: they tap forward, tap back, or leave stories altogether. Exits are the metric that hurts most and the one almost nobody looks at.

YouTube · Video and Short

Retention

The real audience curve: what percentage is still watching at each moment. With the cuts at 30 %, at 50 %, and at the end, plus your channel's average curve to compare against.

62 %At 30 % 48 %At 50 % 31 %Reaches the end

Dotted line: your channel average

TikTok

Consumption

How many finish the whole video and how long they watch on average. Plus the breakdown by country, which loads only when you open the piece so the feed does not wait.

54 %Completion 11.4 sAverage time watched 1.2 MTotal time watched

03 · AI analysis

Dashcrab watches
your videos
and gives you the why.

You request the analysis of a Reel or a TikTok and Dashcrab breaks it down frame by frame against your real consumption metrics. It is not a generic summary: the analysis covers only the window your audience actually watched, and everything it says has to add up against your numbers.

Analyzed window

Only what
your audience watched

If your average watch time is 7 seconds, analyzing the video's 60 is useless. We take your average watch time, add a margin, and that is the clip we analyze. 90 seconds maximum.

Hook strength Moderate

The possible ceiling is capped by your skip rate. The analysis cannot say "strong hook" if 41 % left in the first seconds.

Retention verdict Strong hook,
weak body

One of seven possible verdicts: weak hook, late hook, moderate hook with a weak body, strong hook with a weak body, balanced, strong end to end, or insufficient data.

The video, annotated by the AI

On-screen text

"3 CHANGES · AUTUMN" lands before the first half second and reads without audio.

Why they stay

The first-person cut at second 2 and the promise of "three things" give a clear structure.

Transcript

"Three things I changed this autumn that I wish I had done sooner."

Frame of the analyzed reel: the creator talking to the camera
Key moment · 1.8 s

Cut to close-up and the voice starts. This is where the scroll is decided.

Recommendation

Move the context shot to after the hook.

High severityLow effort
Interaction

14.2k saves, 3 times your average. The piece works as useful content.

Automatic classification · to group and compare

FormatTalking head with B-roll
StyleCasual, straight to camera
TopicRoutine and personal care
PresenterCreator on camera
ProductionPhone, natural light
LanguageRioplatense Spanish
MusicTrending, low volume
FramingVertical, medium shot

With these tags you can ask things that had no answer before: do my talking heads retain better than my B-roll? Does loud music push my skip rate up?

Piece quality

Image8,2
Audio6,4
Energy7,1
Topic8,8

Image quality, audio clarity, visual energy, and topic relevance, scored over the analyzed window.

Transcript and on-screen text

Everything said and everything read, extracted from the video. Useful for reviewing the hook script word by word and for searching across all your pieces.

Voice "Three things I changed this autumn that I wish I had done sooner."
Screen 3 CHANGES · AUTUMN

If there is not enough consumption data yet, we tell you before spending the analysis and you can choose between waiting or reviewing only the first 12 seconds.

04 · Metrics

Everything we
do measure.

No empty cells filled with zeros. If a platform does not report a metric, the card does not show it and the table says "not reported". This is the complete list, by platform.

Platform Main KPI Piece metrics Distinctive signal
Instagram · Reel Engagement rate Views, reach, likes, comments, saves, shares Skip rate, average watch time, 24 h reach curve
Instagram · Story Reach Views, reach, replies, exits Taps forward, taps back, leaves stories
Instagram · Post and Carousel Engagement rate Reach, impressions, likes, comments, saves, shares New followers and profile activity per piece
YouTube · Video Average retention and CTR Views, likes, comments, duration Retention curve, at 30 %, at 50 %, reaches the end
YouTube · Short Percentage watched Views, likes, comments Watched on average and reaches the end
TikTok Views Views, likes, comments, shares, total time watched Completion rate, average time watched, breakdown by country
LinkedIn Impressions Impressions, reactions, comments, reposts, clicks Engagement rate with clicks included over impressions
Totals for the period

148

Posts

Totals for the period

4.2 M

Total views

Totals for the period

312k

Total likes

Totals for the period

2.8 M

Total reach

05 · Audience

It is not a pie chart
with the age
of your followers.

The Audience page brings together all your connected platforms and answers five questions, in this order. Then you can drill into each network, which is where what only that network reports shows up.

Your community 124.8k +3,412 this period People who chose to follow you, across all your networks. We do not de-duplicate: someone who follows you on two platforms counts once per network.
People reached · 30 days 2.1M 17 times your community They saw your content at least once in the period, whether they follow you or not.

Who are you reaching?

38 % already followed you 62 % new people
Instagram58 %
TikTok81 %
YouTube44 %

The share of reach that comes from new people, by platform. If a network does not report the split, we say so instead of estimating it.

How engaged are they?

6,8 % interactions ÷ people reached
Instagram8,4 %
TikTok6,1 %
YouTube3,9 %
LinkedIn2,2 %

On LinkedIn, engagement includes clicks and uses impressions as the denominator, because that is all that API reports.

With how much content, and of what kind?

Followers Non-followers
Reels42 pieces · 1.4M reached
Stories186 pieces · 312k reached
Carousels18 pieces · 208k reached
TikTok videos31 pieces · 890k reached
YouTube Shorts12 pieces · 141k reached

This is where you see the division of labor: Stories talk to your community, Reels and TikToks go out looking for new people.

Where are they?

Top countries

Argentina47 %
Mexico19 %
Spain11 %
Chile8 %

Top cities

Bs As28 %
CDMX12 %
Córdoba9 %
Madrid6 %

Countries and cities of your followers on Instagram and TikTok. On YouTube, countries by views for the period.

Who are they?

Women · 68 % Men · 29 % Not specified · 3 %
18-2434 %
25-3441 %
35-4416 %
45+9 %

Based on current followers. YouTube sometimes hides age and gender when there are few views in the period, and we tell you.

Drill-down · each platform, side by side

Platform Community Reach Engagement New vs community Pieces
Instagram 84.2k1.2M8,4 %58 % new246
TikTok 28.4k712k6,1 %81 % new31
YouTube 9.8k141k3,9 %44 % new24
LinkedIn 2.4k38k2,2 %not reported11

Growth · last 30 days

New+4.128
Unfollows-716
Net+3.412

On TikTok it is shown as new versus lost per day. On LinkedIn Pages, new followers split between organic and paid.

And then, what only that network reports

Instagram
  • Account performance: reach, views, profile views, accounts that engaged, site clicks, interactions, saves, shares, and reposts
  • Follower reach versus external accounts
  • Reach by the surface where the content was shown
  • Views by audience and by content type
  • Age × gender, top countries, and top cities of followers
  • When your followers are online
YouTube
  • Subscribers versus non-subscribers
  • Traffic sources and where your videos get played
  • Where people share you from
  • Top searches inside YouTube and top external sites
  • Performance by format, new versus returning, live versus on demand
  • Devices and operating systems per thumbnail impression
TikTok
  • Followers, total likes, videos, and account engagement
  • Daily growth: new versus lost
  • When your audience is active
  • Gender, age, countries, and cities
  • Benchmark against your category average
  • Trend discovery, mentions of your brand, and best-performing hashtags

If you also have LinkedIn Pages connected, you add industry, job function, seniority, company size, page views by section, and recurring engagers.

When your people are online

The average of followers online by day and hour, in your account's time zone. It is computed from daily snapshots, so it is not an industry average: it is your audience.

You need at least 100 followers on the account for Instagram to report this.

Most online Least online

06 · Compass

Your insights
in one place.

Compass reviews your data and builds a prioritized playbook. Each insight arrives with its hypothesis, the evidence behind it, the concrete actions, and how much effort each one takes. You can mark them as done and rate whether they helped.

High priority Confidence: 82 %

Your Reels over 30 seconds lose 60 % before second 10

Hypothesis The long format opens with context instead of with the promise.
Evidence 14 pieces over 30 s with an average skip rate of 58 %, versus 31 % on pieces under 20 s.
Actions Open with the promise in the first second. Try three long pieces with the hook moved up and compare.
Effort Low
dashcrab.app/f/emilia Updates itself
Profile photo of the sample creator

Emilia Sáenz

@emilia.saenz · Lifestyle and routines · Buenos Aires

124.8kCommunity
2.1M30-day reach
6.8%Engagement
Reel

My autumn routine, short version

882kViews 41.2kLikes 1.8kComments 8.4%Eng. rate
TikTok

3 staples for cold mornings

512kViews 28.4kLikes 946Comments 6.1%Eng. rate
Short

A day at home, unscripted

141kViews 6.2kLikes 312Comments 3.9%Eng. rate

07 · Public feed

Your media kit,
always up to date.

Build a public feed with the pieces and metrics you choose, and share it by link with brands. It updates itself with your real data, so you do not have to redo the PDF every time someone writes to you.

08 · Pricing

Start free
No card.

What changes between plans is how many integrations you connect, how often they refresh, and how many AI analyses of Reels and TikToks you get per month.

creator

USD 0

To get started

  • 2 integrations
  • Daily refresh
  • 1 AI analysis per month
  • GEO Observer free
  • Support within 1 week
Create a free account
Creator Pro

USD 59

For pro creators

  • 8 integrations
  • Hourly refresh
  • 100 AI analyses per month
  • MCP included
  • Support within 48 hours
Choose Creator Pro

AI analyses apply to content published after you connect the account.

09 · Questions

What people ask
before connecting.

What exactly does the AI analyze in my videos?

Dashcrab analyzes the video together with your real consumption metrics and returns hook strength, a retention verdict, why people stay and why they leave, the key moments with their timestamps, recommendations prioritized by impact and effort, the content classification, and the full transcript.

Why does it only analyze part of the video?

Because analyzing the 60 seconds of a video people watch 7 of tells you nothing useful. We take your average watch time plus a margin, with a 90-second maximum. If there is not enough consumption data, we warn you before spending the analysis.

Can I analyze content I published before connecting?

No. Analyses apply to content published after you connect the account, because we need the consumption metrics we start recording from that moment.

How long does connecting my accounts take?

About 10 seconds per integration. One Google login connects YouTube and Google Analytics at once. In under two minutes you have the whole stack running.

Does it really start free?

Yes. The Creator plan is USD 0 per month, no card. You connect one integration and start seeing real data right away.

What happens to my data if I change plans?

Your history travels with you. You move up or down a plan without reconnecting anything.

Start today

Stop guessing
what worked.

Connect one account, look at your first analyzed piece, and decide whether it is useful. Free, no card.